Cafe 23: Admin & Employee Centered Dashboard Design
Date: January - May 2023
Overview
The second part of my Application Design and Development class involved using Figma and Human-Centered design principles to create mockup dashboards for Admins and Managers to address their needs. We will dive into their problems, desires, and painpoints as well as discuss how the dashboard mockups address these needs.
Personas
Our first persona is a Manager named Kathryn. Kathryn is a 35 year old Store Manager for the Oakland Cafe 23 store. She has been working at cafe 23 for 10 years and her goal is to efficiently manage store operations, ensure fair shift assignments, streamline payroll, track employee tasks, and have quick access to employee information.
The second persona is an Admin named Alex. Alex founded cafe 23 two decades ago. His primary goals are to oversee the entire Cafe23 network, optimize performance, make data-driven decisions, and ensure the business's overall success.
Pain Points
Manager Pain Points
- Shift Management: Struggles to ensure equitable shift assignments and timely announcements to employees.
- Payroll Processing: Often forgets to generate and submit weekly payroll on time, which impacts employee incomes.
- Task Tracking: Difficulties in keeping up-to-date records of tasks performed by employees.
- Employee Contact: Struggles to quickly access employee contact information for emergencies.
- Employee Records: Finds it challenging to make quick updates to employee records in case of life changes.
Admin Pain Points
- Performance Metrics: Clear performance metrics for each store and the entire network.
- Key Performance Indicators (KPIs): Identifying the right KPIs to gauge business health.
- Data Analysis: Analyzing data to make informed decisions.
User Stories
- Admin: Oversees all of Cafe23.
- Managers: Run individual stores and the employees for their store.
As a "Role" |
I want to ... |
So that I can... |
|---|---|---|
Admin |
See the yearly profits across all my stores |
See how well my buisness is doing |
Admin |
See quanitfiable information for each of my managers |
determine if my managers are doing their job well |
Admin |
See which stores have the most employees under 18 years old |
Can spread those employees out more and adhere to proper labor laws |
Admin |
See store averages for yearly, quarterly, and monthly metrics |
Get a sense for how well each individual store is doing. |
Manager |
See info on all my employees |
Reach employees quickly in emergencies |
Manager |
Be able to edit my employees info |
Can adjust to changes in my employees lives |
Manager |
See when payroll is due |
Pay my employees on time |
Manager |
Add shifts |
Make sure the store has proper shift coverage |
Manager |
See what shifts are not covered |
Can ensure the store has 100% shift coverage |
Manager |
See which employees have under the expected hours |
Ensure equal shift allocation. |
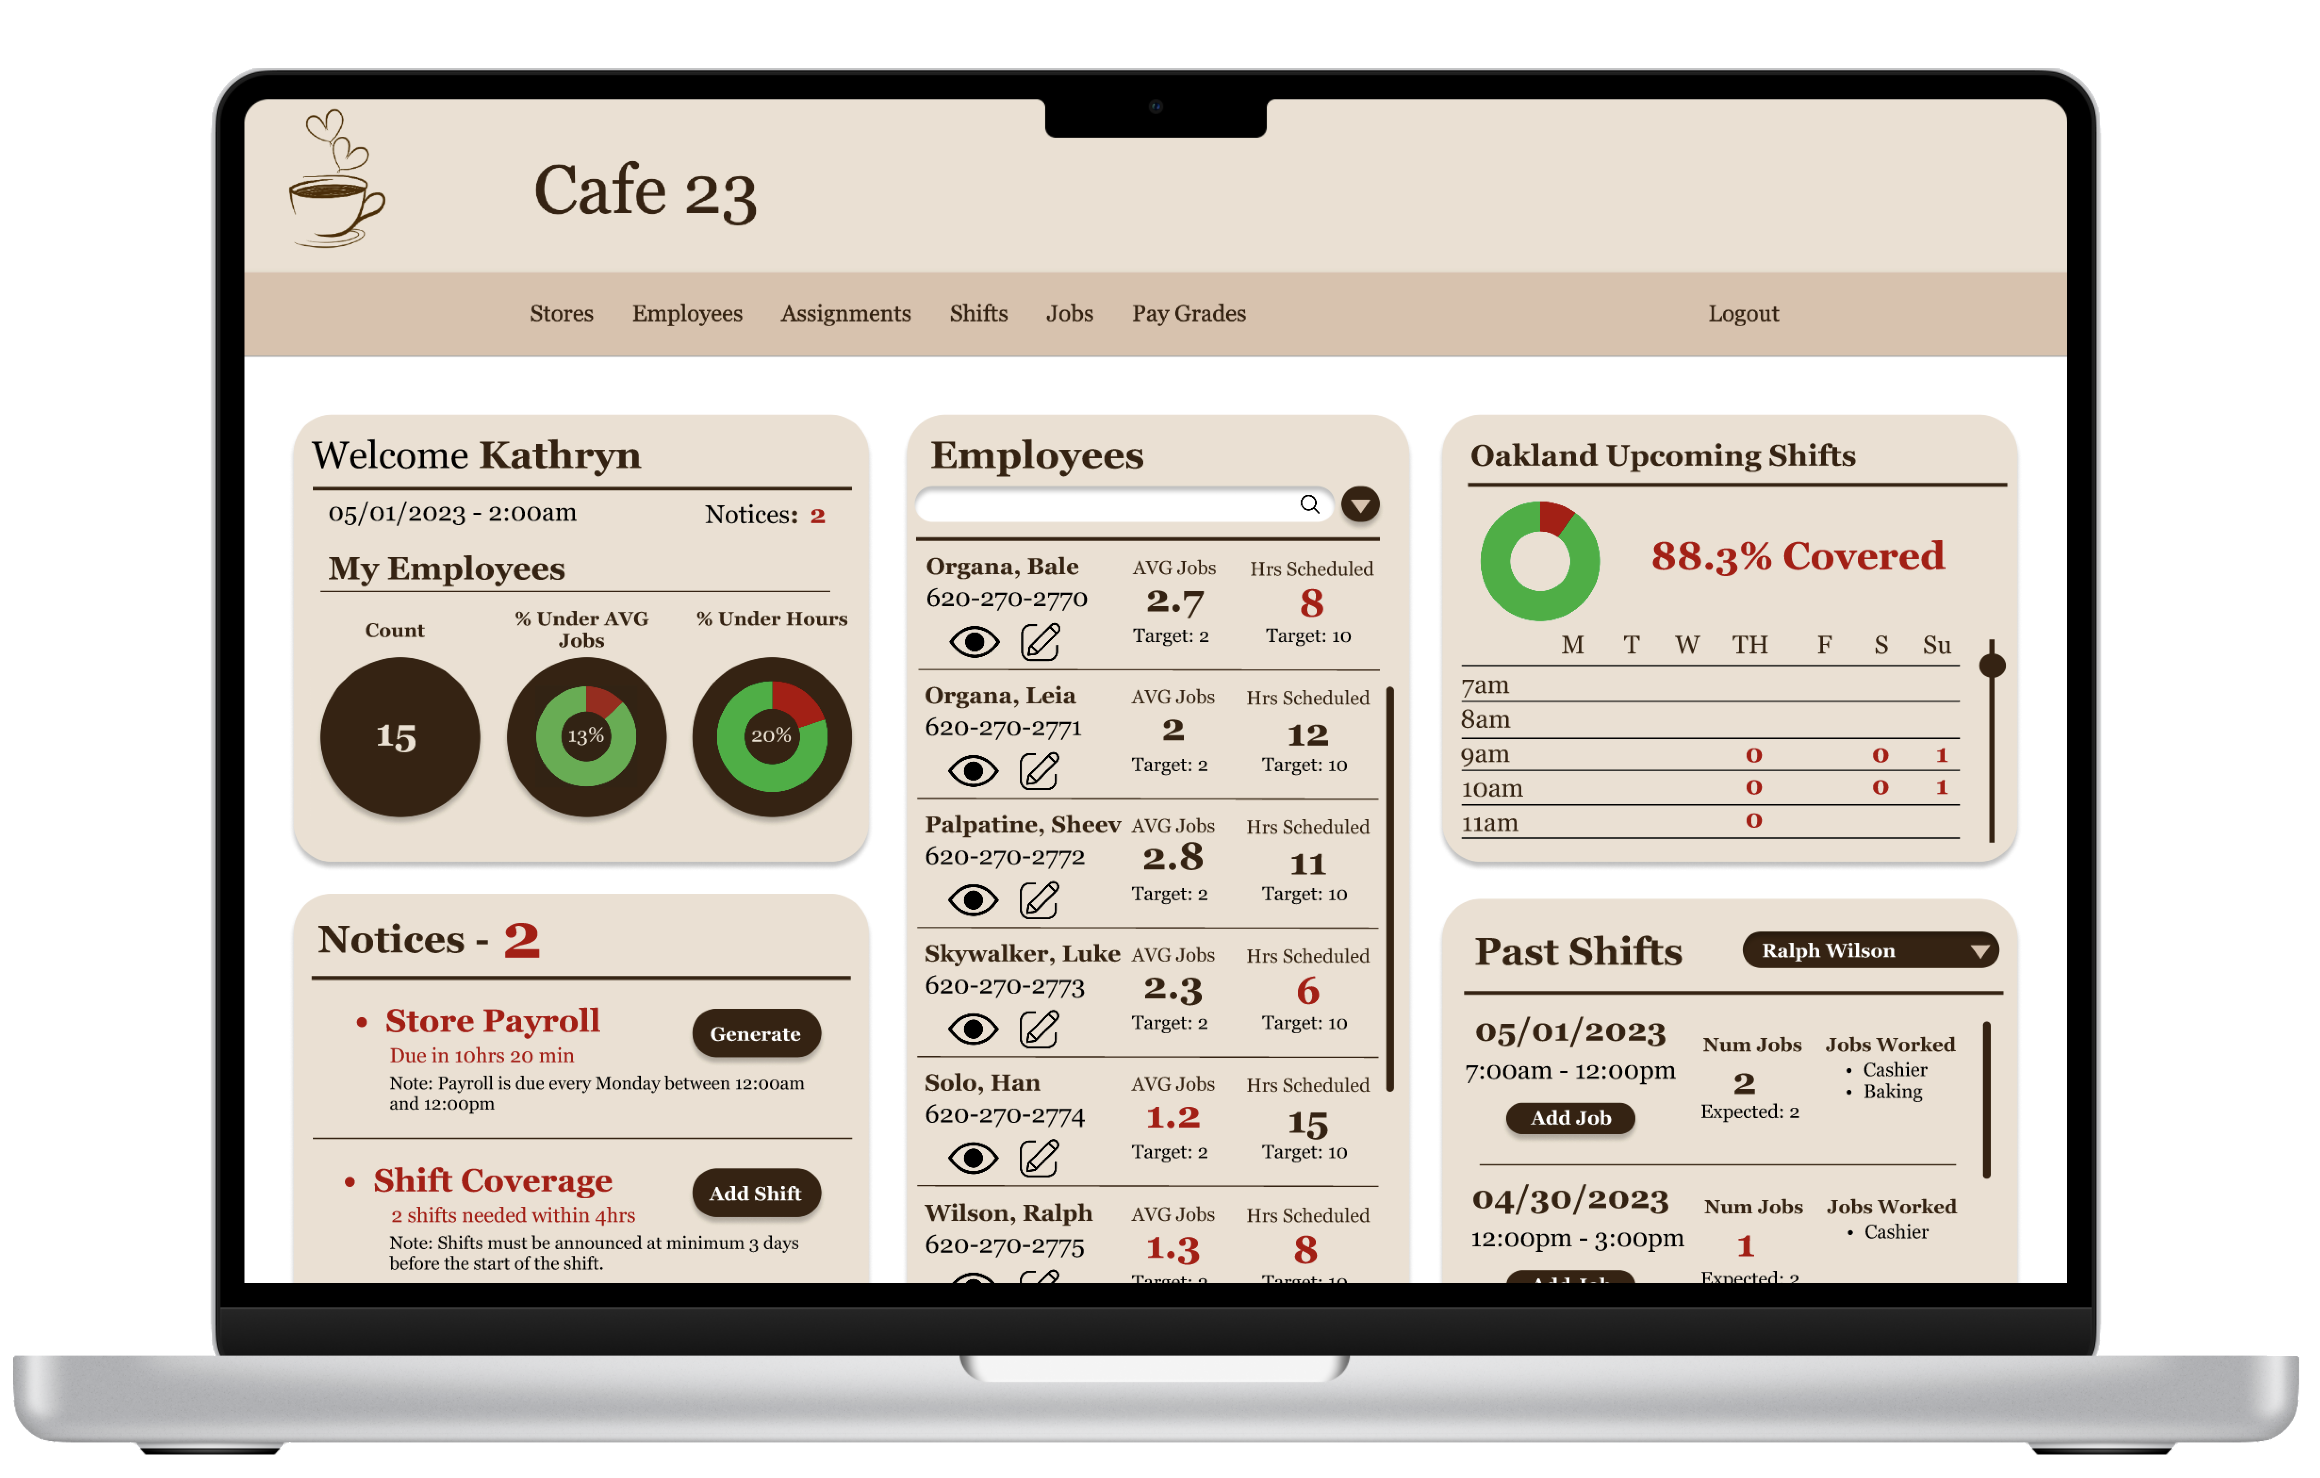
Manager Dashboard
Manager Dashboard Interactions
Employee Management
Managers have access to comprehensive information about their store's employees, including statistics on the average number of tasks completed during a shift and the current scheduling hours. At the forefront of this data, managers can readily view key metrics such as the total number of employees, the percentage of employees performing below the average number of tasks, and the percentage of employees working fewer hours than expected.
Important Notices
Managers will notice red alerts strategically placed in two prominent areas for immediate attention. The first is adjacent to their name within the initial section of the screen. The second is a dedicated section exclusively for notices related to shift coverage and payroll, ensuring swift attention and efficient resolution of pertinent issues.
Shift Coverage
Managers have access to a weekly shift coverage chart, allowing them to promptly identify shifts with only one or no scheduled employees. Additionally, they can view a chart displaying the current percentage of shift coverage at the module's top. Adding new shifts for employees is also conveniently streamlined for their convenience.
Admin Dashboard
Admin Dashboard Interactions
Manager Managment
Administrators primarily focus on the overall performance of stores and managers, leaving the day-to-day management of individual employees to the managers themselves. This dashboard design provides comprehensive insights into manager-related metrics. It includes critical data points, such as whether managers have their shifts or payroll adequately covered. Furthermore, administrators can access information about managers, such as the number of instances they've missed payroll or the number of times their store has experienced incomplete shift coverage. These statistics serve as quantifiable measures of a manager's effectiveness and success in their role.
Store Management
Administrators also have access to detailed information about individual stores. One of the modules provides store averages, offering a comprehensive overview of various profit statistics on a yearly, quarterly, and monthly basis for each store. Additionally, administrators can review employee statistics for each store, including the average number of weekly absences, the count of underage workers at a particular store, and the average duration of employee lateness to their shifts at that specific store. These insights empower administrators to closely monitor and manage the performance and compliance of individual stores within the organization.
Profits
Managers have access to a weekly shift coverage chart, allowing them to promptly identify shifts with only one or no scheduled employees. Additionally, they can view a chart displaying the current percentage of shift coverage at the module's top. Adding new shifts for employees is also conveniently streamlined for their convenience.
Takeaways
Over the course of this project I learned about ruby on rails and using MVC for creating apps. I also learned more about concepts in web design such as reduction of cognitive load and the gulf of expectation and the gulf of evaluation. I intend on building upon the principles I learned in this class to further my understanding of app and web development.