Case Study: Enhancing Game Design Project Presentations with Targeted Dashboards
Date: April 2023
Overview
In this UX case study, we explore the design and development of two specialized dashboards aimed at elevating the experience of Professor Rodriguez's game design project presentations. The objective was to provide student presenters with constructive feedback through these two user-centric dashboards.
Context
Professor Rodriguez's class required an innovative solution to enhance the game design project presentation process. The existing method lacked targeted feedback and often failed to address the individual needs of the student presenters. Our challenge was to create a user-centered solution that addressed the diverse goals and pain points of the presenters.
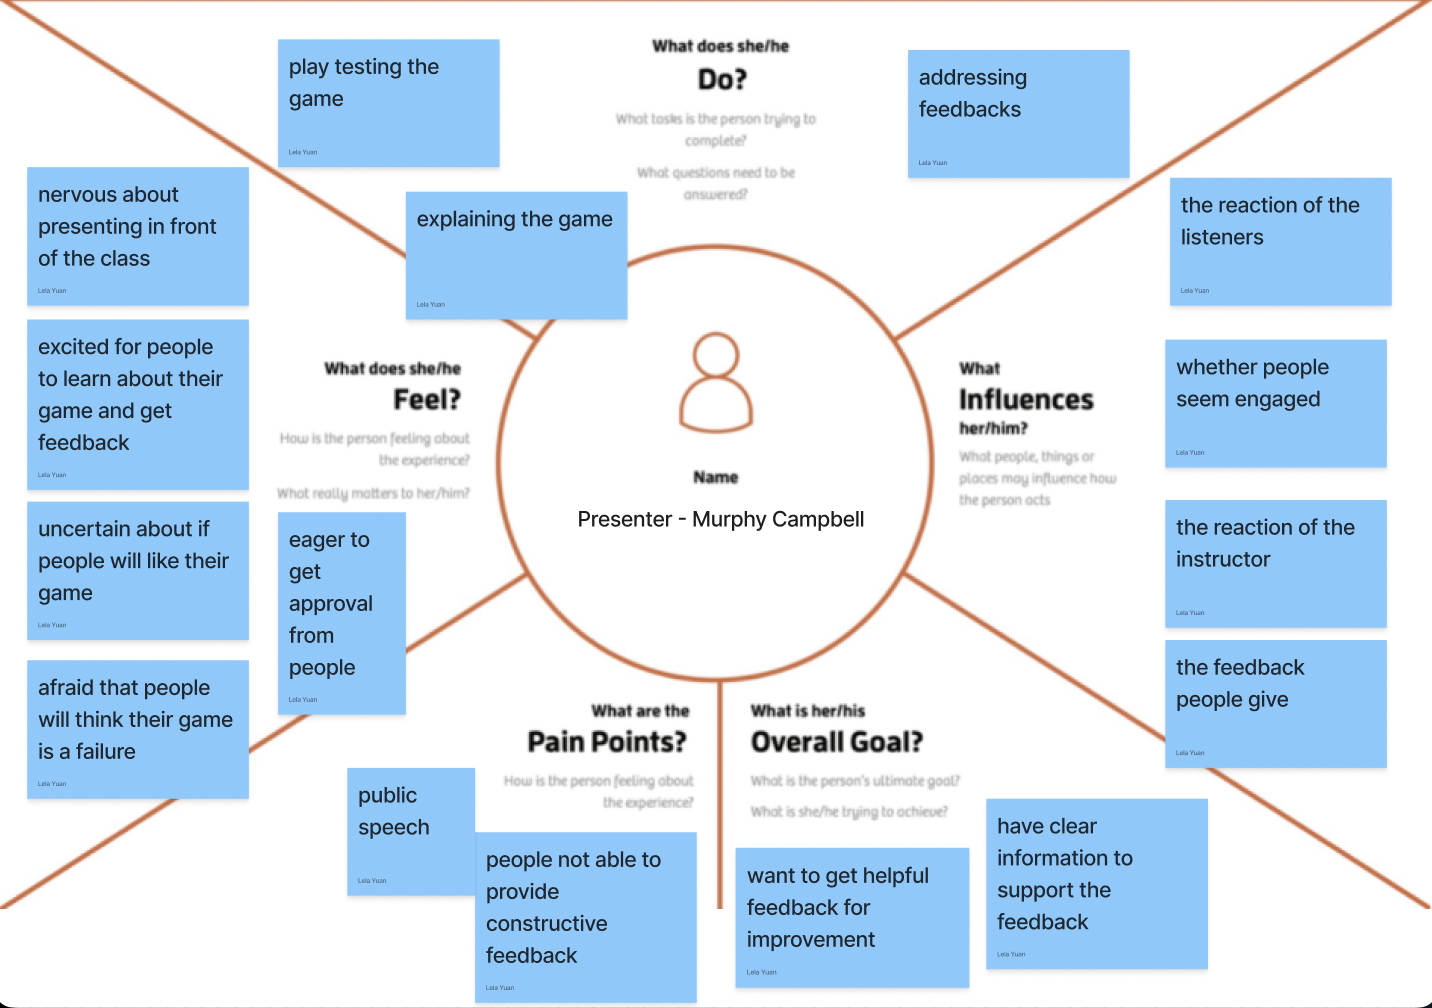
Persona Analysis
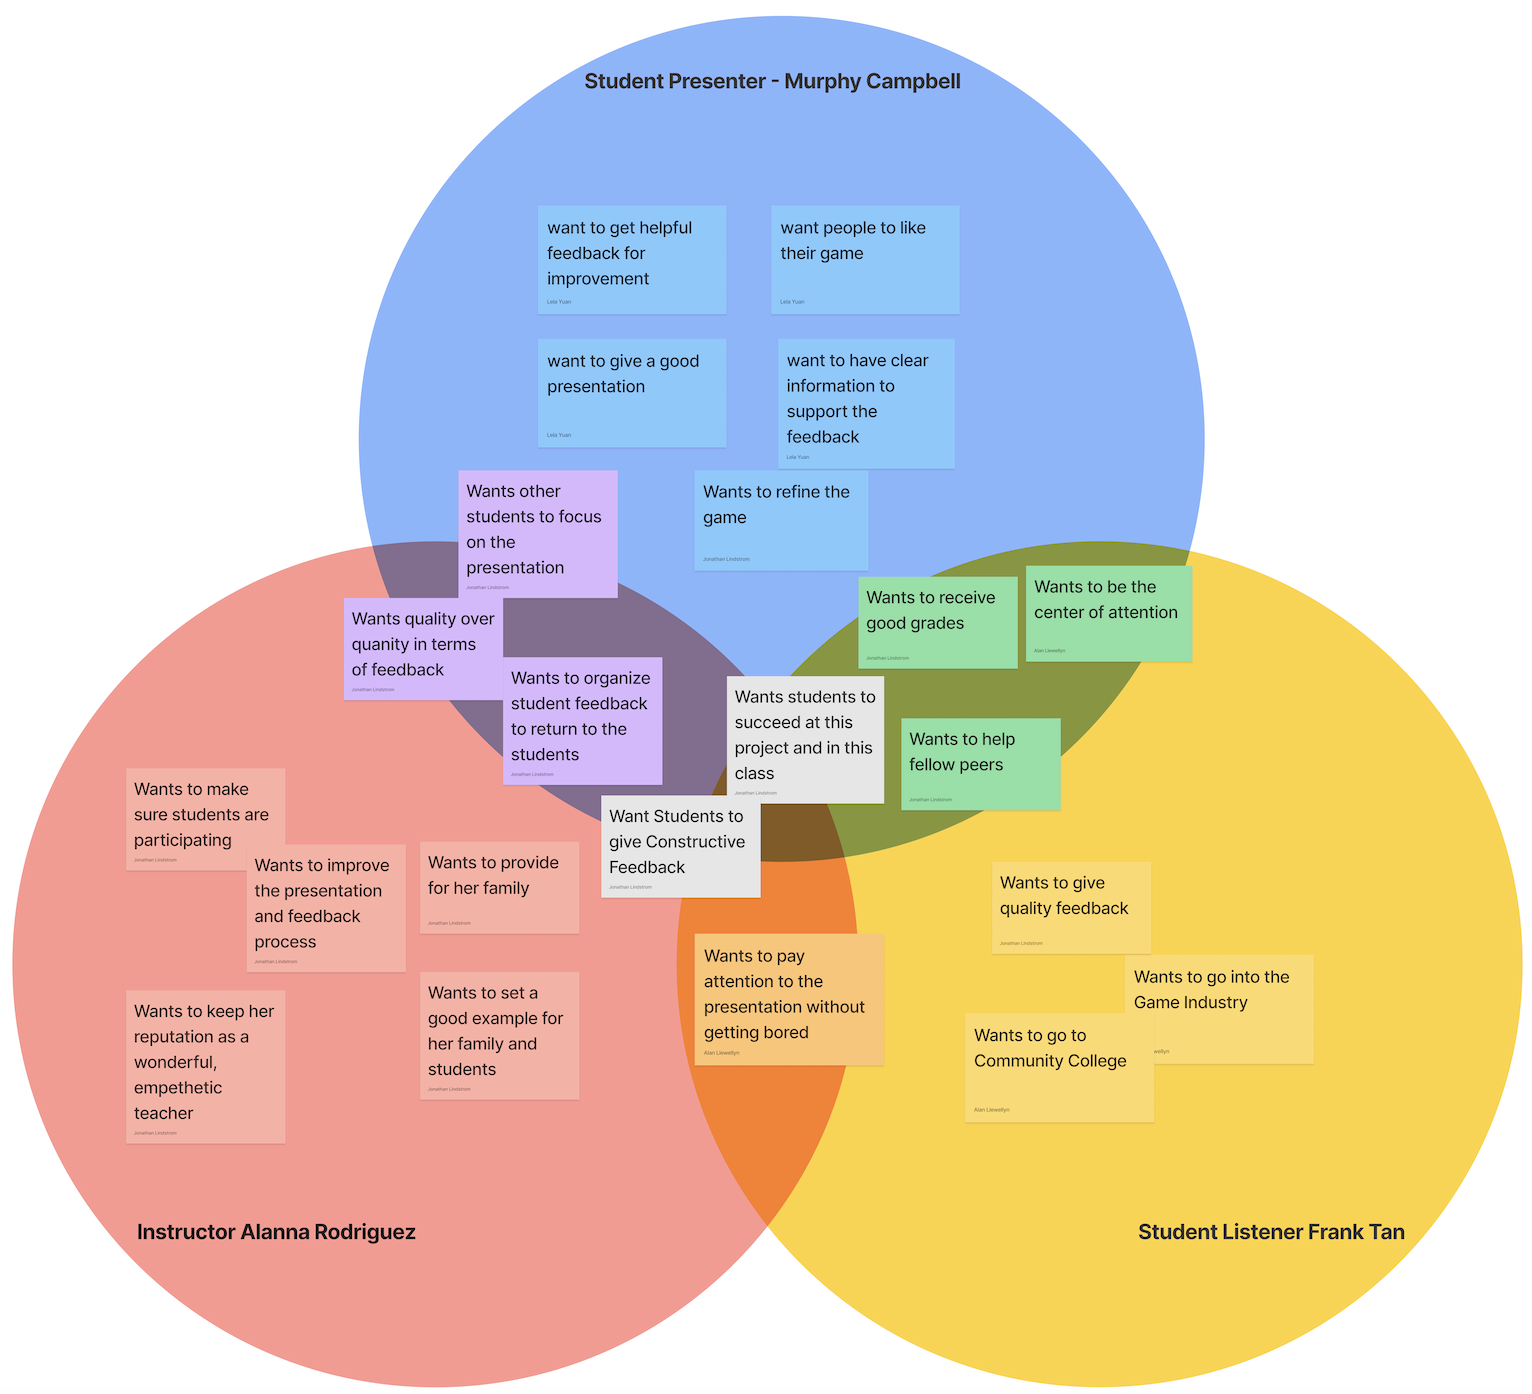
We analyzed these three distinct personas to gain a deep understanding of their expectations, motivations, and challenges. This analysis, showed below, allowed us to tailor the dashboards to meet the unique needs of each persona.
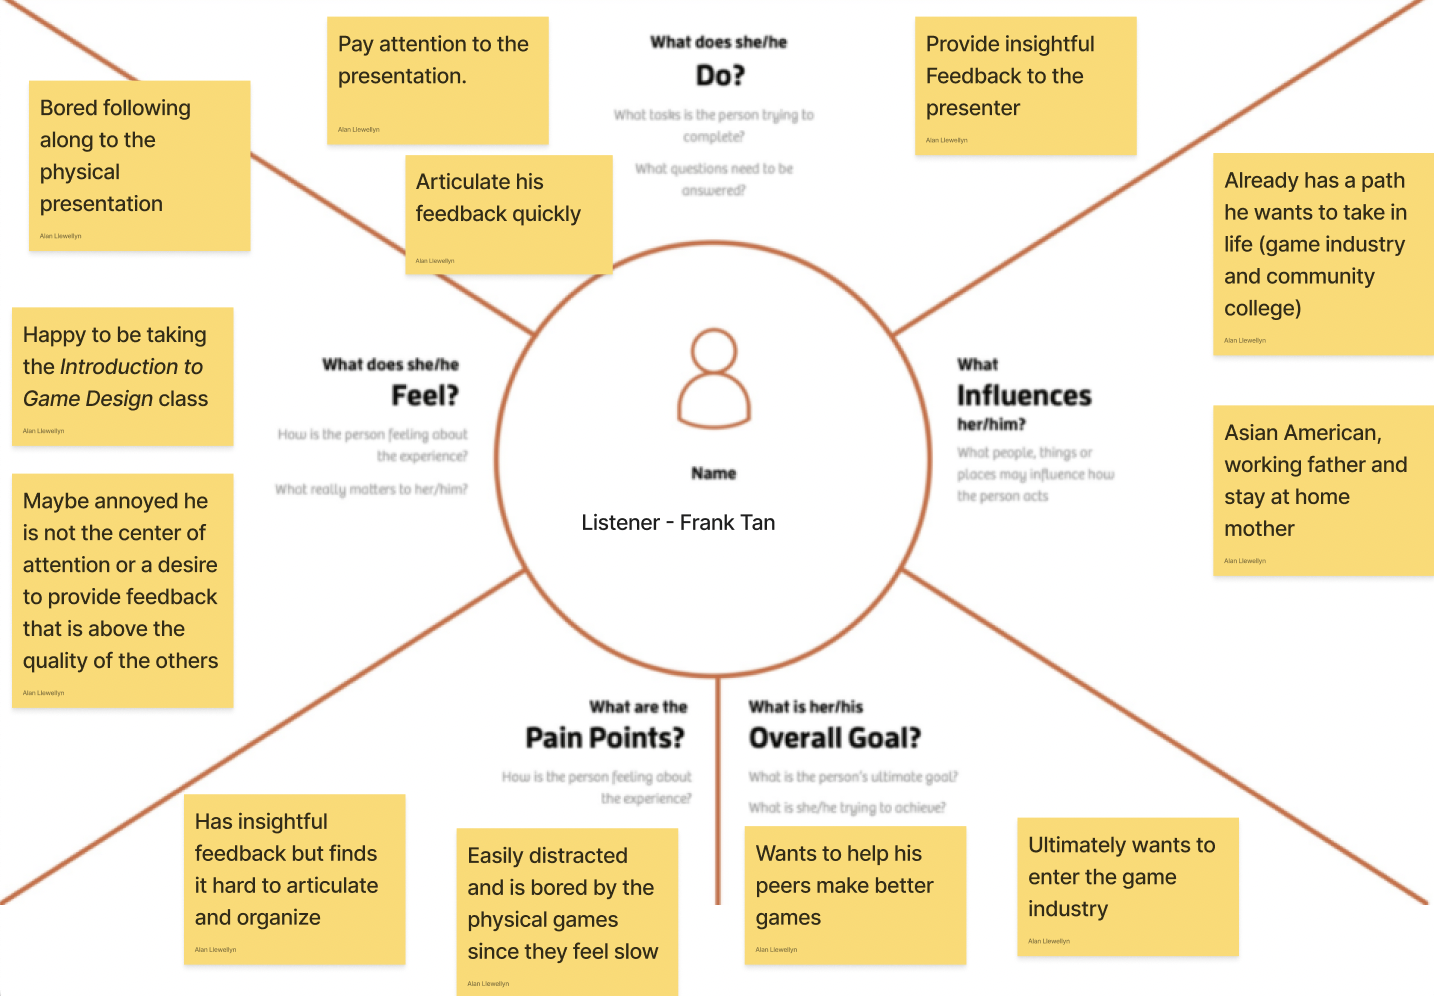
- Frank Tan: Loves video games and wants to be in the industry, has a short attention span, & loves giving feedback to his peers
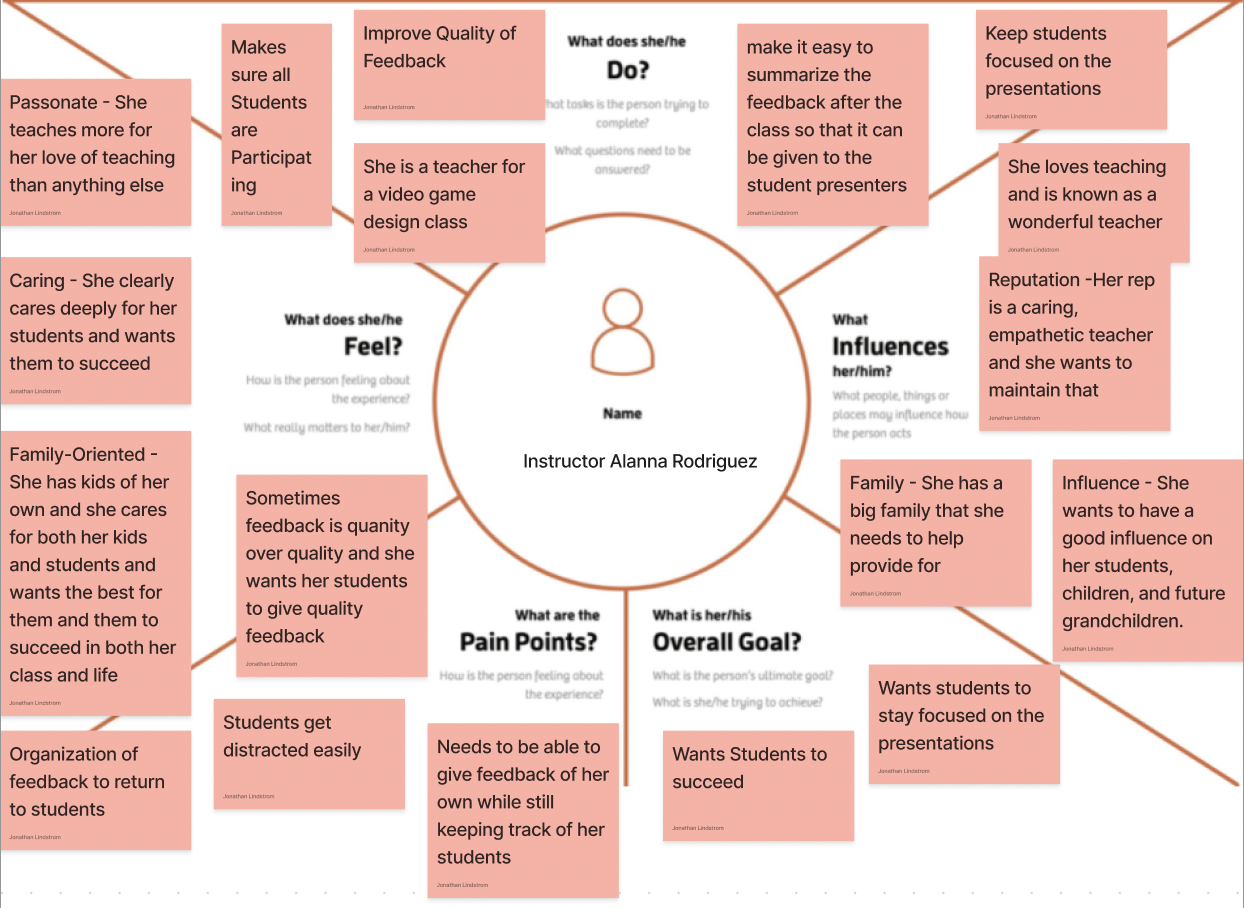
- Alanna Rodriguez: Teaches an elective game design course, students study game theroy and work in teams creating games.
- Murphy Campbell: Takes mostly AP courses, Taking this course because he loved making card games for his little sisters
Empathy Maps
Needs Analysis
Needs analysis for all personas
Before diving into the dashboards we had to analize our personas and their needs to determine what was important to include on the dashboard.
To carry out the needs analysis we referred back to the three empathy maps and took each individual’s overall goals and pain points. Many of the sticky notes overlap with the “what does ____ want to do"(The top section of the empathy maps). Some noteable takeaways are Both Frank and Alanna want constructive, quality feedback. Furthermore, Both want the presenter to succeed and to not be distracted from the presenter.
User Stories
- Student Presenter: Is giving a presentation on a game they made(doesn't have a dashboard)
- Student Listener: Is providing feedback for the student presenter
- Teacher: Runs the class, wants the student presenters to get good feedback and wants the student listeners to be paying attention
As a "Role" |
I want to ... |
So that I can... |
|---|---|---|
Teacher |
See currently active and inactive students |
See which students are activley participating and on task |
Teacher |
Provide feedback to the presenter |
Give my students feedback on their presentations |
Teacher |
See my student listeners feedback |
See the quality of feedback my students are giving |
Student Presenter |
my classmates to see questions I came up with |
get feedback for the parts of my game I am unsure about. |
Student Listener |
Provide quality feedback for my peers |
help my peers improve their presentations |
Student Listener |
Stay on task |
Pay attention to the student presenter |
Student Listener |
Provide general feedback |
give the student presenter feedback not related to their questions |
Student Listener |
See what other students have given for feedback |
Not give repetitive feedback |
Sketches
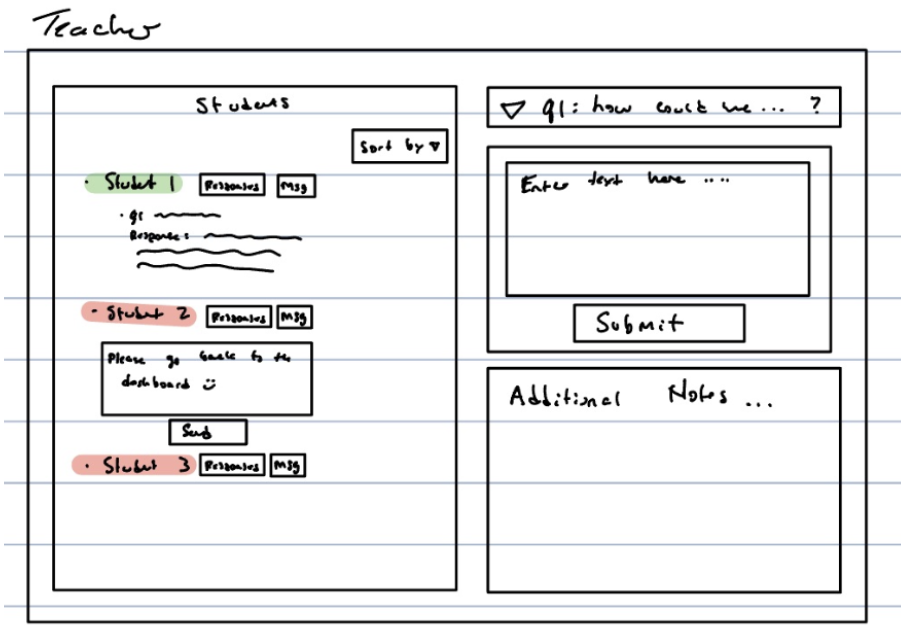
Rough Sketch for teacher dashboard
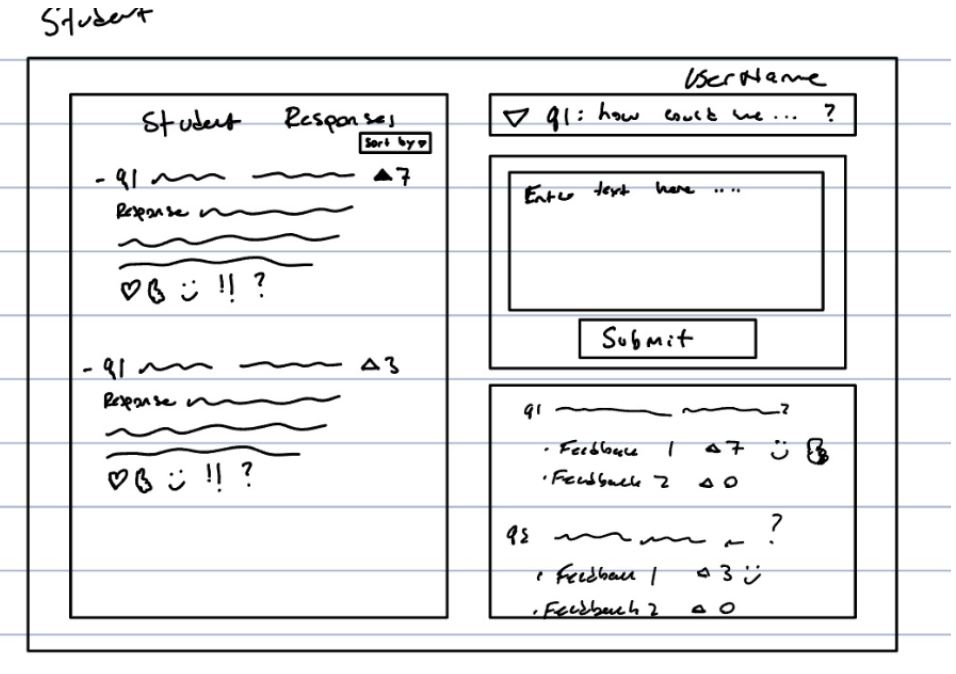
Rough Sketch for student dashboard
Our rough sketches for the teacher dashboard focused on providing clear insights into student engagement levels. We introduced color highlights as visual indicators, enabling teachers to quickly identify students who require more interaction. Additionally, the 'sort by' feature enhances efficiency by allowing teachers to sort and locate specific student profiles, such as inactive participants.
The student dashboard was thoughtfully designed to remain unobtrusive during presentations, ensuring minimal distraction. Listeners can view fellow students' responses, enabling a collaborative environment. The introduction of positive emotes and upvoting options fosters a constructive feedback culture, aligning with the teacher's encouragement of positive engagement.
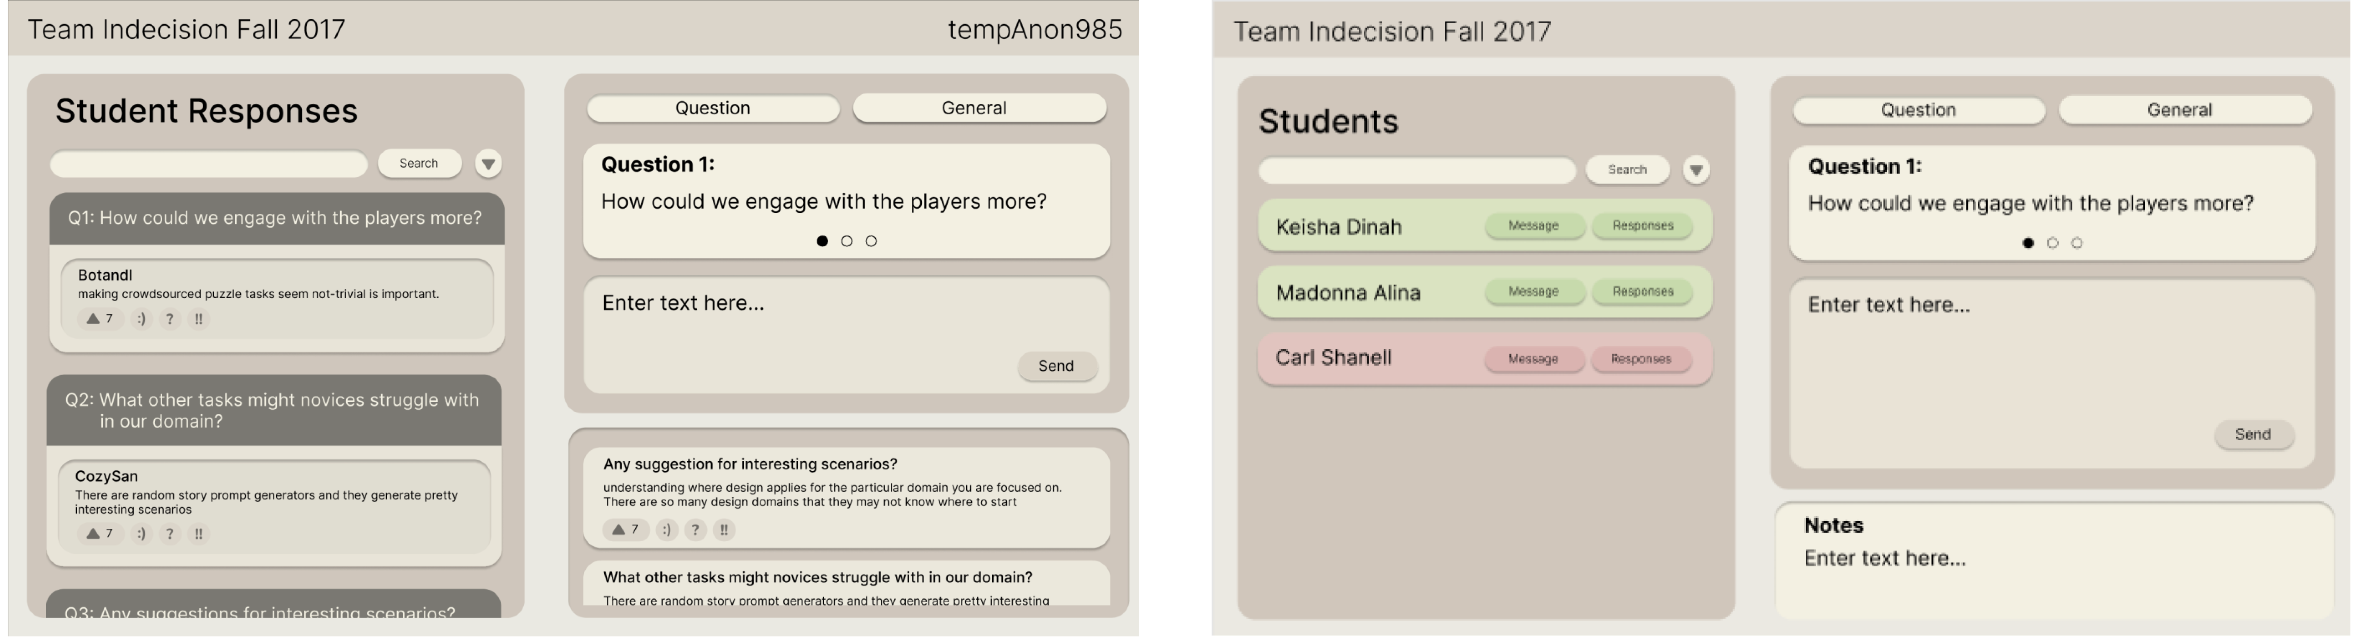
Final Prototypes
Final Student Dashboard Prototype
Final Teacher Dashboard Prototype
When designing the student dashboard our primary focus was on creating a seamless and intuitive experience for engaging with fellow students' feedback and expressing your own thoughts. The design philosophy centered around maintaining a clean and uncomplicated dashboard interface to ensure an undistracted user interaction.
As for the teacher dashboard, our objective was to spotlight the activities of her students while concurrently offering a straightforward avenue for her to deliver constructive feedback to student presenters. The design aimed to strike a balance between showcasing student activity analytics and facilitating convenient opportunities for the teacher to contribute her valuable input.
What Surprised me
I found it truly surprising to witness the dynamic evolution of the dashboards throughout the development process. It's fascinating to observe how incorporating the individual needs and pain points of users can wield such a significant influence over the ultimate design choices. The journey highlighted the remarkable impact of user-centric design on shaping the final product.
Reflections
This whole case study has taught me the importance of really digging into understanding the people we're designing for. I was amazed at how much the personas, empathy maps, and needs analysis guided our dashboard development. Designing something that truly works for users comes from really knowing them.
I've realized that the time spent on persona analysis is like an investment in the final user experience. The empathy maps gave us a peek into what drives our users, and the needs analysis helped us see their pain points and desires. It made every design decision make so much more sense in the end.